
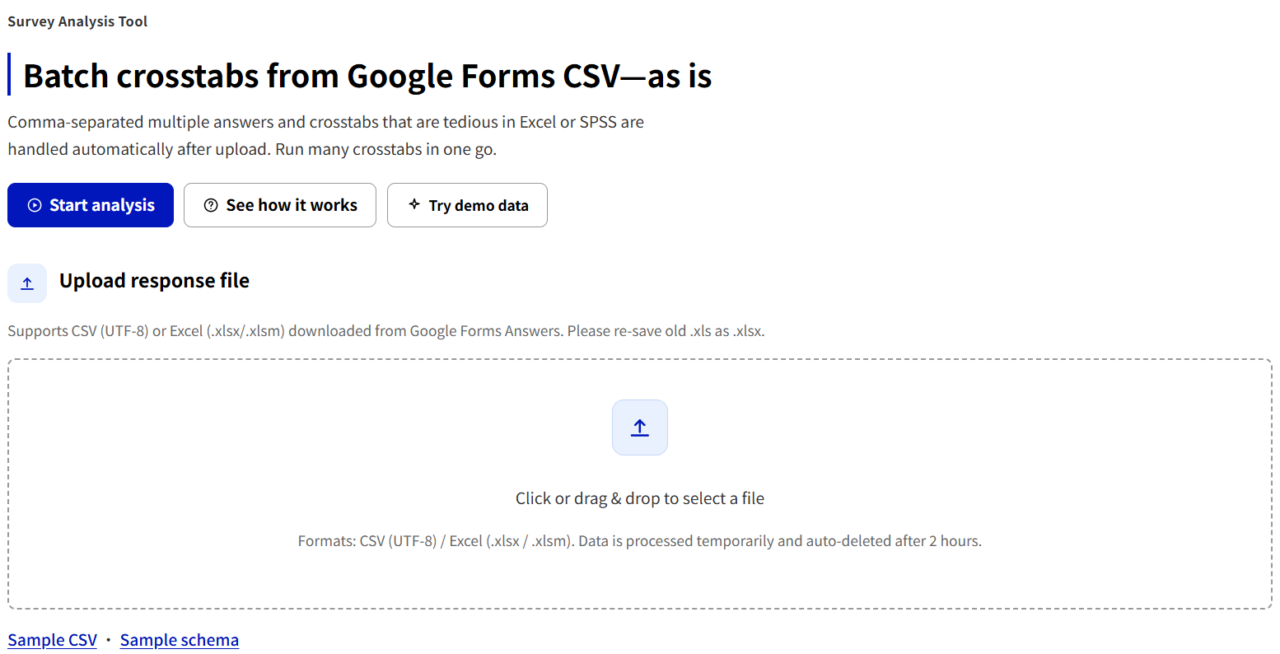
Google Forms is a convenient and widely accessible tool for collecting survey responses, particularly for students and researchers conducting questionnaires for academic projects, theses, dissertations, and institutional studies. Collecting responses, however, is only the first stage of survey research. Once the data have been collected, researchers often need to organize the dataset, calculate response frequencies, process multiple-response questions, and create cross-tabulation tables before they can begin interpreting the results. When a questionnaire contains many questions or receives hundreds of responses, these preliminary tasks can require a considerable amount of time. To simplify this process, We have developed a web-based Survey Analysis Tool that allows users to direclty upload survey data and generate summary and cross-tabulation tables more efficiently.
From Google Forms to Analysis
The Survey Analysis Tool is designed to work with data exported from Google Forms, making it particularly useful for researchers who already use Google Forms to conduct surveys. After collecting responses, users can download the response data as a CSV file and upload it directly to the tool. The system then allows users to define the type of each question and specify variables such as gender, age group, academic year, or other demographic characteristics that may be used in the analysis. Instead of repeatedly reorganizing data and creating individual tables in spreadsheet software, researchers can prepare multiple summary tables within a single workflow. This makes it easier to move from data collection to the actual interpretation of survey results.
Handling Multiple-Response Questions
Multiple-response questions are one of the areas in which survey data preparation can become particularly time-consuming. For example, a questionnaire may ask participants to select all of the learning methods, services, applications, or activities that they have used. In Google Forms, responses to these checkbox questions may be stored as several answers within a single cell, which makes them more difficult to summarize than ordinary single-answer questions. Researchers may therefore need to separate the responses or create additional variables before calculating frequencies and percentages. The Survey Analysis Tool processes these Multiple Answer (MA) questions automatically, allowing each selected option to be counted appropriately and included in subsequent analysis. This reduces the amount of manual data preparation required before examining the results.
Creating Cross-Tabulation Tables
Cross-tabulation is an important part of descriptive survey analysis because overall percentages alone may hide meaningful differences between groups of respondents. A researcher may, for example, want to compare responses between undergraduate and graduate students, examine differences among age groups, or investigate whether participants with different levels of experience respond differently to a particular question. The Survey Analysis Tool allows users to select variables and generate cross-tabulation tables without creating each table individually. Demographic variables can be compared with questionnaire items, and questionnaire items can also be compared with one another when appropriate. This is especially useful when a study includes many survey questions and requires the researcher to examine the same variables from several perspectives.
Reducing Repetitive Work in Survey Research
Preparing survey data for analysis often involves a large amount of repetitive work that does not directly contribute to the interpretation of the research findings. Researchers may spend significant time separating multiple responses, calculating frequencies and percentages, constructing tables, and formatting the results for reports or academic papers. Although these processes are necessary, performing them manually for every question can be inefficient and can also increase the possibility of human error. By automating part of this preliminary processing, the Survey Analysis Tool allows researchers to spend more of their time examining patterns in the data and considering what those patterns mean in relation to their research questions.
Supporting Student Research
The tool may be particularly helpful for undergraduate and graduate students who are conducting survey research for the first time. Students working on graduation theses, master’s theses, seminar projects, or research assignments may understand what they want to investigate but may be less familiar with the practical procedures required to organize survey data. Creating dozens of tables manually in Excel can become a significant obstacle, especially when a questionnaire contains multiple-answer questions or several demographic variables. The Survey Analysis Tool provides a more straightforward way to create the basic tables needed to understand a dataset. It can therefore serve as a useful bridge between collecting questionnaire responses and conducting more detailed statistical analysis.
A Starting Point for Further Statistical Analysis
The Survey Analysis Tool is intended to support descriptive analysis and data preparation rather than replace specialized statistical software. Depending on the research design, researchers may still need software such as R, SPSS, Python, or other statistical tools to conduct hypothesis testing, regression analysis, factor analysis, or other advanced statistical procedures. However, not every stage of survey analysis requires advanced statistical software. Before conducting inferential analysis, researchers often need to understand the basic distribution of responses and examine relationships between variables. By simplifying frequency analysis, multiple-response processing, and cross-tabulation, the tool can provide a practical starting point for exploring survey data before moving on to more advanced analyses.
Exporting Results for Further Use
Survey analysis rarely ends with viewing the results on a screen. Researchers often need to transfer their tables into research notes, presentations, reports, theses, or other documents. For this reason, the Survey Analysis Tool allows analysis results to be exported for further use in applications such as Excel and Word. Researchers can use the exported data as a basis for creating tables and figures that match the formatting requirements of their institution, academic paper, or research report. This allows the tool to support not only the initial analysis of the survey but also the subsequent process of organizing and presenting the findings.
Using AI to Assist with Survey Configuration
Large questionnaires may contain dozens of variables, and defining each question as a single-answer question, multiple-answer question, or demographic variable can itself require time. The Survey Analysis Tool therefore also provides a workflow in which generative AI services such as ChatGPT or Claude can assist with preparing the question configuration. Researchers can provide information about their questionnaire and CSV column names to an AI system and use the resulting configuration as a starting point for the analysis. This approach can be especially helpful when working with surveys that contain many questions, although researchers should always review the generated configuration to ensure that it accurately reflects the design of their questionnaire.
Designed for Researchers, Students, and Educators
The Survey Analysis Tool can be used in a wide range of research contexts, including undergraduate research projects, graduation theses, master’s theses, educational research, student and faculty surveys, customer surveys, and institutional questionnaires. It may be especially useful for researchers who use Google Forms because of its simplicity but find the subsequent data-processing stage more complicated than expected. The purpose of the tool is not to automate the interpretation of research findings or make statistical decisions on behalf of the researcher. Instead, it focuses on reducing the repetitive technical work between collecting responses and beginning meaningful analysis.
Spend More Time on Research, Not on Repetitive Data Processing
Survey research should primarily involve asking meaningful questions, examining evidence, and interpreting what the data reveal. Nevertheless, researchers and students can easily spend hours performing repetitive spreadsheet operations before they reach that stage. Processing multiple-answer questions, calculating basic distributions, and creating numerous cross-tabulation tables are necessary tasks, but they do not always need to be performed manually. The Survey Analysis Tool was developed to make these procedures more efficient and accessible. If you use Google Forms for academic or research surveys, the tool can help you move more smoothly from collecting responses to analyzing your data.
Try the Survey Analysis Tool for Free
About Maleete Inc
Maleete Inc develops practical digital solutions by identifying repetitive and inefficient processes that can be simplified through technology. Rather than introducing systems simply for the sake of digitalization, we focus on understanding how people actually work and designing tools that reduce unnecessary steps. The Survey Analysis Tool is one example of this approach: a relatively simple system designed to solve a specific but common problem faced by researchers and students. Through system development and IT/DX support, Maleete aims to create technology that allows people to spend less time managing processes and more time focusing on the work that actually requires their expertise.
Upload your CSV and automate multiple-response processing and cross-tabulation.
Google Forms makes it easy to create surveys and collect responses.
But once the responses start coming in, the real work begins.
You may want to:
- Compare responses by age group
- Analyze results by gender or other respondent attributes
- Process multiple-answer questions
- Create cross-tabulation tables for reports
- Generate summary tables for dozens of survey questions
As the number of respondents and questions increases, manually creating tables in Excel can become surprisingly time-consuming.
Multiple-answer questions, in particular, often require additional processing because several selected options may be stored together in a single cell.
To make this process easier, Maleete Co., Ltd. has developed a web-based Survey Analysis Tool designed to streamline survey aggregation and cross-tabulation.
Simply Upload Your Google Forms CSV
The workflow is straightforward.
Download the survey responses from Google Forms as a CSV file, then upload the file to the Survey Analysis Tool.
You can then review the question types and select the fields you would like to use for cross-tabulation, such as age group, gender, department, or other respondent attributes.
The tool supports both CSV and Excel files and can automatically generate multiple types of summary and cross-tabulation tables.
Instead of manually repeating a workflow such as:
Cleaning the CSV → Splitting multiple responses → Creating pivot tables → Building cross-tabulations → Formatting each table
you can process much of the work in one place.
Automatically Process Multiple-Answer Questions
One of the most time-consuming parts of survey analysis is handling checkbox or multiple-answer questions.
For example:
“Which of the following services have you used? Select all that apply.”
A respondent may answer:
Service A, Service C, Service D
In a CSV file, these selections are often stored together in a single cell.
This makes them more difficult to aggregate than standard single-answer questions and may require additional preprocessing before analysis.
Our Survey Analysis Tool automatically processes these types of Multiple Answer (MA) responses.
Once processed, they can be used not only for basic frequency tables, but also for cross-tabulation.
Generate Cross-Tabulations Automatically
Overall survey results are useful, but they do not always tell the whole story.
You may want to know:
Do people in their 20s answer differently from people in their 50s?
Does customer satisfaction differ by gender?
Do users and non-users of a particular service show different preferences?
Cross-tabulation makes it possible to identify these differences.
With the Survey Analysis Tool, you can designate fields such as age group or gender as respondent attributes and automatically generate cross-tabulations across multiple survey questions.
You can also create custom combinations, including:
- Question × Question
- Attribute × Question
- Attribute × Attribute
Even if your questionnaire contains 20 or 30 questions, you do not need to build every table manually.
Export Your Results to Excel and Word
The analysis does not end on the browser screen.
Survey results can also be downloaded in formats suitable for further editing, reporting, and documentation.
Basic summaries include counts and percentages for each response option, while cross-tabulation results can be exported for use in reports and presentations.
Excel exports can also include information such as the original response data, question definitions, summary tables, and charts.
Our goal is not simply to help you analyze the data.
It is to make the process from survey responses to reporting as efficient as possible.
Recommended Use Cases
The Survey Analysis Tool can be used for many types of surveys, including:
- Academic research, theses, and dissertations
- Student, parent, and staff surveys at schools and universities
- Customer satisfaction surveys
- Employee engagement and internal company surveys
- Government and public-sector surveys
- Event and seminar feedback forms
- Market research
- Product and service surveys
- Any survey conducted using Google Forms
It is particularly useful for people who have successfully collected responses with Google Forms but are unsure how to efficiently aggregate and analyze the results afterward.
AI-Assisted Survey Configuration
When a questionnaire contains many questions, manually identifying each column as a Single Answer (SA), Multiple Answer (MA), or respondent attribute can itself become time-consuming.
The tool therefore also provides guidance for using generative AI services such as ChatGPT or Claude to create survey configuration data.
By providing the questionnaire structure and CSV column names to an AI system, users can prepare the configuration and import it into the analysis tool.
This can significantly reduce the initial setup required for larger surveys.
Free to Use in Your Web Browser
The Survey Analysis Tool is available online and can be used free of charge.
No software installation is required.
Uploaded survey data is temporarily stored only for processing and is automatically deleted within a maximum of two hours. The service is not designed to permanently retain uploaded datasets.
If your survey contains personal, confidential, or sensitive information, please make sure that its use complies with your organization’s information security policies before uploading the data.
From Collecting Responses to Analyzing Them
Google Forms is an excellent tool for creating surveys and collecting responses.
However, when a survey contains hundreds of responses and dozens of questions, the aggregation and analysis process can require a considerable amount of manual work.
We developed this tool around a simple question:
“Does someone really need to repeat this task manually every time?”
The Survey Analysis Tool is not intended to replace advanced statistical analysis software.
Instead, it is designed to simplify the repetitive tasks that often come before deeper analysis, including:
Creating basic summary tables.
Processing multiple-answer questions.
Generating cross-tabulations.
Exporting the results to Excel.
If you regularly use Google Forms for surveys, we invite you to try it.